Malo e lelei My name is christian and for this weeks blog will be a double line graph we were learning how to make these and I learnt with this success criteria .
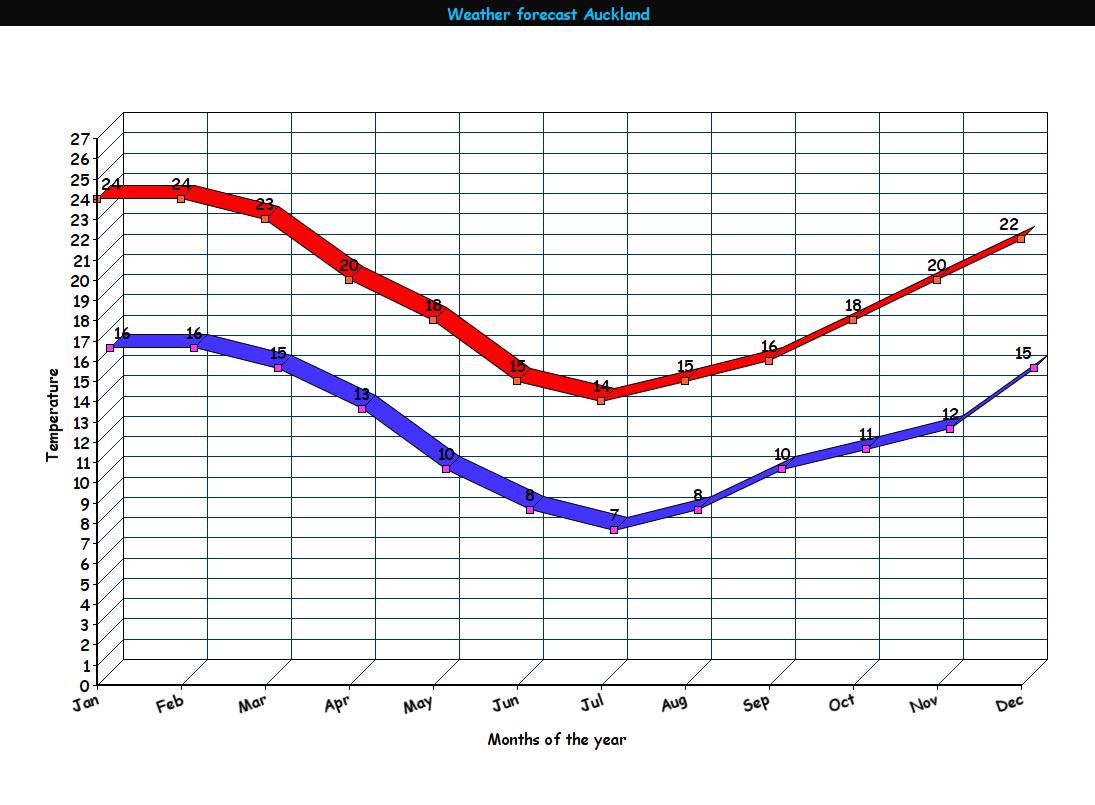
Put time along the x axis
Put value or measurement along the y axis
Give our chart a title
Draw dots above the time when we line them up with the value
- Connect the dots with straight lines
* Red is the hot temperature!
* Blue is the cold temperature!